
| HOME | |
| Vintage Year Indexes
|
|
We do our vintage years by the year in which a company got its first round of funding. We find that vintage analysis is more consistent and more informative when done this way. In 2000, pretty much all valuations were too high. A fund that raised money in 1999 but waited until 2002 to invest was much better off. It was smart of them to wait, but how did they do compared to others who made investments in 2002? Our style of vintage year will tell. The vintage years show the evolution of capital calls, investments, private company value in the portfolios, and distributions over the life of the companies in that vintage. Vintage years can be done for all venture capital, for any industry subset, for any geography, and any stage. The vintage years can be done either gross or net of expenses and carry.
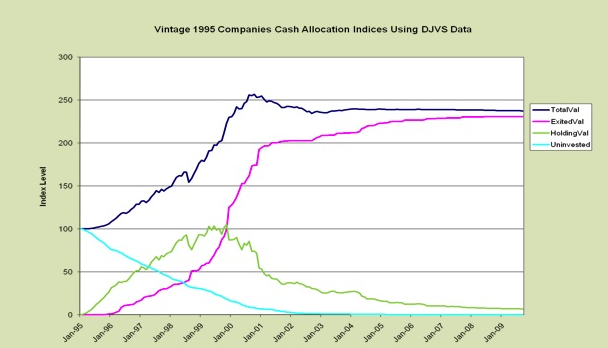
The 1995 vintage was the best year to date for venture capital. In the graph above, the turquoise line represents uncalled capital (per $100 of total investment for the vintage), the green line is the total value of private company value in the portfolio, the purple line shows the exit value from IPOs and acquisitions (carried forward at zero interest) and the dark blue line is shows the total value, which is the sum of the other three. |
|
© 2003–2014 Sand Hill Econometrics Incorporated. Illustrations are from historic stock certificates. Please read our Privacy Policy and Terms of Service. |
|
Data is the plural of anecdote
|